How 35 Years of Satellite Data Rank This El Niño
How 35 Years of Satellite Data Rank This El Niño
Main visual for How 35 Years of Satellite Data Rank This El Niño
🇪🇸 Where this El Niño lands on a 35 year ruler
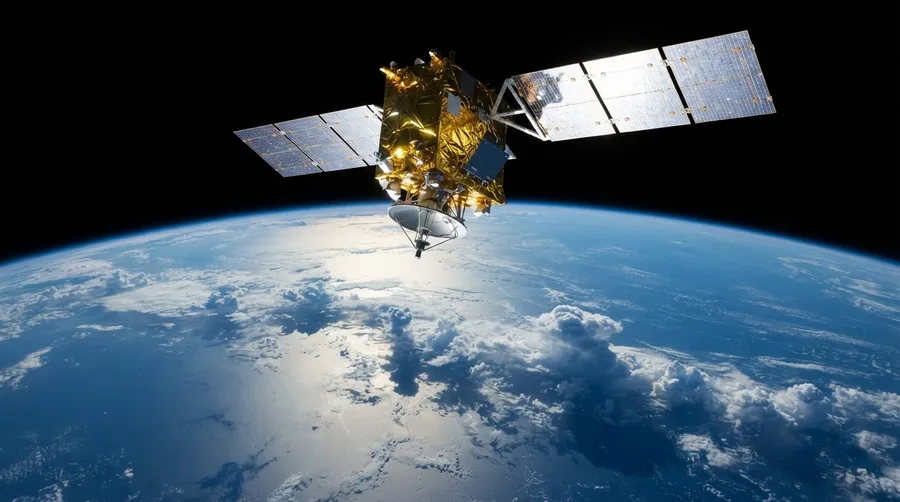
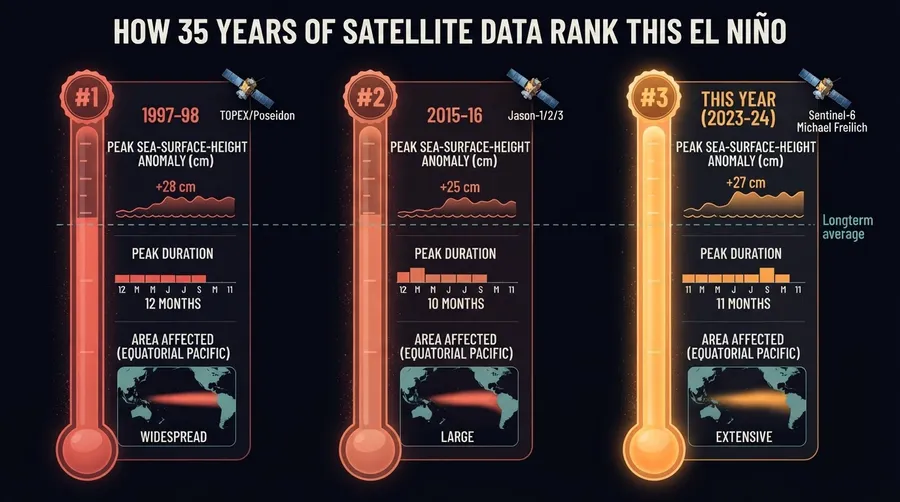
Start with the ruler. Satellites have been bouncing radar off the ocean since 1992, and that record now runs about 35 years. Long enough to hold this El Niño next to the monsters. 1997 is the one everybody reaches for. Then 2015. The altimeters track how high the sea surface sits across the equatorial Pacific, and this year the eastern side is bulging upward in a way that puts it in the same conversation as those events. The same conversation, not the same spot. I want to be careful there. Ranking depends on which stretch of ocean you measure and which month you pick, and the final order will not settle until the event fades.
🇪🇸 Dónde queda este El Niño en una regla de 35 años
Lo que más me llamó la atención es la regla. Desde 1992 los satélites miden la altura del mar, y con 35 años de datos por fin hay con qué comparar. El evento de 1997 es la vara de siempre, y el de 2015 le sigue de cerca. Este año el Pacífico oriental se ve hinchado, más alto de lo normal, y eso lo mete en la misma conversación. Pero ojo. El puesto exacto depende de qué zona midas y en qué mes. Yo no me atrevería a dar un número todavía. Antes de 1992 no hubo altímetros, así que el famoso evento de 1982 se queda fuera de esta comparación.
Detail view related to How 35 Years of Satellite Data Rank This El Niño
🇺🇸 An old phenomenon, a newer way of watching it
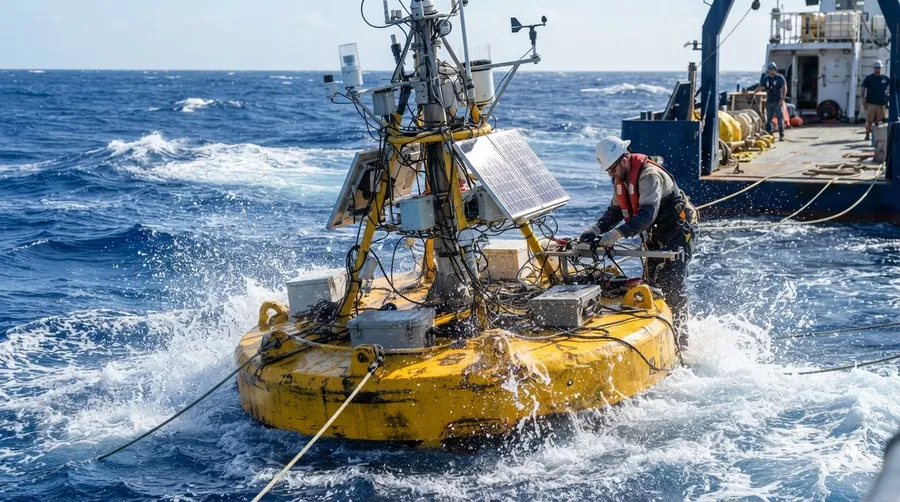
El Niño is old news. Peruvian fishermen named it long ago for the warm water that showed up around Christmas. For decades people tracked it with ships and moored buoys, which is patchy work in an ocean that size. Then came the 1982 event, which caught almost everyone off guard, and a line of buoys was strung across the equatorial Pacific in its wake. Good instruments. Still points on a very large map. Altimetry changed the scale, because suddenly you got the whole basin every ten days or so. The 1997 event was the first one watched that way from start to finish, which is strange, if you think about it, given how much we already believed we knew.
🇪🇸 Un fenómeno viejo y una forma nueva de mirarlo
Nada de esto empezó con los satélites. Los pescadores del norte de Perú le pusieron nombre al agua tibia que aparecía cerca de la Navidad. Durante décadas se estudió con barcos y boyas, puntos sueltos en un océano gigante. Después del evento de 1982, que agarró desprevenida a casi toda la comunidad científica, se armó una red de boyas a lo largo del Pacífico ecuatorial. Fue un salto grande. Los altímetros llegaron en los noventa y cambiaron la escala, porque ya no mirabas un punto sino la cuenca entera, cada diez días más o menos. A mí me parece curioso que 1997 fuera el primero que vimos completo desde arriba.
Scientific diagram illustrating key concepts of How 35 Years of Satellite Data Rank This El Niño
🇺🇸 How a radar echo becomes a measure of heat
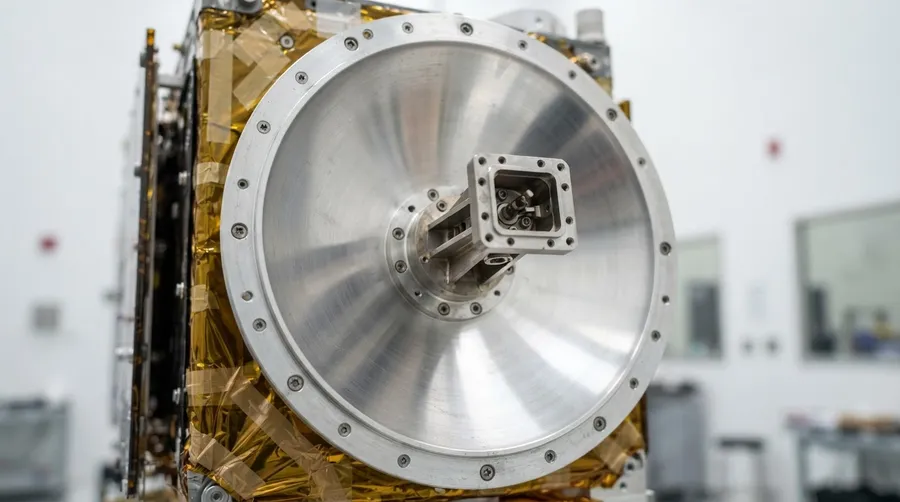
Here is the mechanism, as best I can lay it out. A satellite fires a radar pulse down and times the echo. Knowing exactly where the satellite sits, you get the height of the sea surface, good to a few centimeters. Now the ocean part. Normally the trade winds pile warm water into the western Pacific. In an El Niño those winds slacken, and the warm pool slides east, carried by slow waves running under the surface. Warm water expands, and a deeper warm layer lifts the surface above it. So the eastern Pacific can climb by tens of centimeters, and the altimeter sees that bulge across the whole basin at once. I do not fully follow how the winds and the water feed each other. Researchers call it a feedback loop, and I kept rereading that explanation.
🇪🇸 Cómo un eco de radar se vuelve una medida de calor
Piensa en un eco. El satélite manda un pulso de radar hacia abajo, mide cuánto tarda en volver, y con su posición exacta calcula la altura del mar con un error de pocos centímetros. Lo difícil es entender qué pasa debajo. Normalmente los vientos alisios empujan el agua cálida hacia el Pacífico occidental. En El Niño esos vientos se aflojan y la masa de agua tibia se desliza hacia el este, empujada por ondas lentas bajo la superficie. El agua caliente se expande, la capa tibia se profundiza y la superficie sube. En el Pacífico oriental puede subir decenas de centímetros. Lo del ciclo que se alimenta a sí mismo, viento y océano empujándose, todavía me cuesta verlo completo.
The process described in How 35 Years of Satellite Data Rank This El Niño
🇺🇸 Floods in Peru, drought in the Cibao
Peru and Ecuador come first. Strong events bring coastal rain, flooded towns, and anchovy fisheries that collapse when the cold, nutrient rich water disappears. That part has played out before. For the Dominican Republic the story is quieter but real. El Niño years tend to bring drier conditions to parts of the Caribbean, which means pressure on rice and plantain farmers, on reservoirs, and on the dams that generate electricity. The same warm Pacific also adds wind shear over the Atlantic, so hurricane seasons often run calmer. Often. Not always. A farmer in the Cibao does not need a ranking of events. He needs to know whether to plant or wait, and a good altimeter record helps forecasters judge how big the swing might be.
🇪🇸 Inundaciones en Perú, sequía en el Cibao
Para la República Dominicana el efecto no llega de golpe. Llega con la sequía. En años de El Niño fuerte el Caribe suele quedar más seco, y eso aprieta a los productores de arroz y plátano, a los acueductos y a las presas que generan electricidad. Del lado bueno, el mismo Pacífico caliente suele meter cizalladura de viento sobre el Atlántico, y la temporada ciclónica tiende a calmarse. Tiende, no promete. En Perú y Ecuador es otro cuento: lluvias, inundaciones en la costa y pesquerías de anchoveta que se hunden. Un agricultor en el Cibao no necesita saber el puesto del evento en una lista. Necesita saber si siembra o espera.
🇺🇸 What nobody can answer yet
Nobody knows yet if this event will top the 1997 sea surface height in the eastern Pacific. That answer comes only after the peak passes. Another gap is Caribbean rainfall. The link to El Niño is real, but its timing shifts from one event to the next. And a warming background ocean muddies every comparison, since 35 years holds only a handful of strong events.
🇪🇸 Lo que nadie sabe todavía
Nadie sabe todavía si este evento superará la altura del mar de 1997 en el Pacífico oriental. Eso se sabrá cuando pase el pico. Tampoco está claro cuándo llegará la sequía al Caribe, porque el momento cambia de un evento a otro. Y un océano de fondo cada vez más cálido enreda toda comparación, ya que 35 años apenas dan un puñado de eventos fuertes.
Real world context for How 35 Years of Satellite Data Rank This El Niño
🔗 Related Articles | Artículos Relacionados
Nuestro canal transmite datos curiosos de ciencia, IA, espacio y tecnología las 24 horas. | Our channel streams science facts, AI, space and technology around the clock.
▶ Ver transmisión | Watch liveOPEN YOUR MIND
Source: Source
Join the conversation